
Churn is when a customer stops using a company’s product or cancels his subscription. Considering that retaining an existing customers is usually cheaper than acquiring a new customer, it will be valuable to a company if it could predict which customers are at risk of churning. I created a model from predicting customer churn using the K Nearest Neighbour algorithm.
The data for this model was gotten from here. It is customer data for an unidentified telecommunications company.
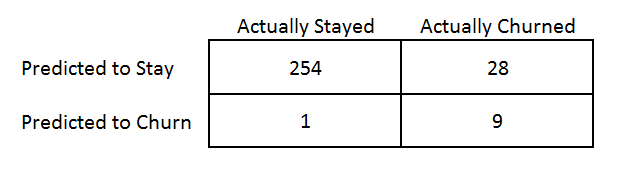
The model used to predict churn was K-Nearest Neighbours. The overall accuracy was 90%. 9 out of 10 customers who were predicted to stay by the model ended up staying, while 9 out of 10 of the customers predicted to churn by the model ended up churning.
The Model
KNN is a simple algorithm. When a new customer is presented, the algorithm looks through the database for customers who are most similar to the target customer. It then predicts if the customer would churn based on whether those similar customers churned or not.
The data set contains 976 customers of a telecommunications company. 125 of them churned while 851 stayed.
To make the model, I split the data into two. 70 per cent was put in a training set and used to create the model. The model was then used to predict if the other 30% churned or not.
The available variables were:
- State
- Account Length
- Area Code
- Phone
- Int’l Plan
- Vmail Plan
- Vmail Message
- Day Mins
- Day Calls
- Day Charge
- Eve Mins Eve Calls
- Eve Charge
- Night Mins
- Night Calls
- Night Charge
- Intl Mins
- Intl Calls
- Intl Charge
- Cust Serv Calls
KNN only works with numerical variables, so for this model I will remove all non-numerical variables (There are techniques for using categorical variables like one-hot encoding, but we’ll ignore them here).
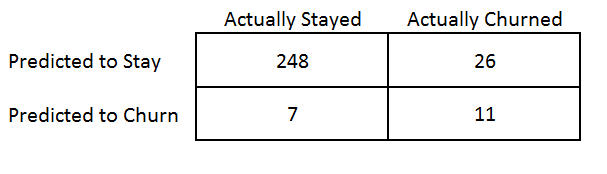
How did the model perform? Here are the results:
Optimising the model
The initial accuracy of 89% was good, but the model can be made more accurate if we carefully select the value of k and the variables to use to make predictions.
I initially used a K of three. This means that the model will look for the three most similar customers and use them to predict if the customer will churn or not.
If K is too small the model will be “overfit”. This means that the model will do well on the data you used to create it, but when it comes across new observations it will perform poorly.
If K is too high, the model will also perform poorly. The best value of K is selected by picking one that is not to high or low.
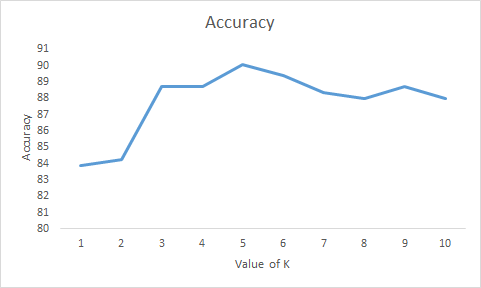
As the graph above shows, the model accuracy increases steadily until it peaks at 5, where is starts to drop. Therefore, the best value of k is 5.
After using k = 5, model performance improved to 90%
Variable Selection
Not all variable are useful in predicting if a customer will churn. For example, the customers phone number is completely useless in predicting because it is unique to each customer.
A technique called information gain was used to see which variables are most important in predicting churn. Information gains looks at each variable individually and asks “If we split the data set by this variable alone, how much easier is it to make a prediction on the outcome”.
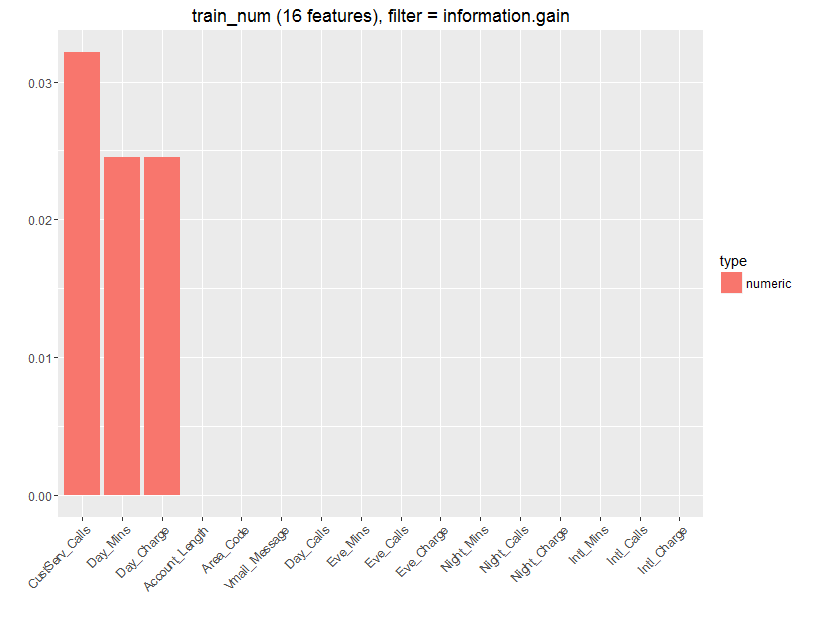
This shows that customer service calls, number of mins called and credit used are the most informative variables. This is understandable, a client calling customer care a lot is probably not satisfied with the service so is more likely to churn. While people who make a lot of calls are probably satisfied with the service and so are unlikely to churn. So these three variables tell us a lot about the probability of a customer churning.
Probability Threshold
KNN gives a probability of a particular customer churning. The threshold is usually set to .5 by default. This means that anyone with a probability of more than .5 is predicted to churn. If you reduce the probability threshold, more people will be predicted to churn, this gives you a higher number of “at risk customers” to target. However, this increases the likelihood that customers who are not at risk will pass the threshold and be predicted to churn.
The choice of the probability threshold will be based on the business context, if the company wants to target a large amount of customers then a low threshold will be set. However, if the company wants to be more efficient in spending a higher threshold will be set, at the cost of a smaller number of customers to target.
Business Implications.
With this model, one can predict which customers are at risk of churning. The company can then take steps to retain these customers, for example:
- Customer Satisfaction Surveys can be sent to the at “risk customers” to try to find out what their opinion of the company and possible complaints are.
- Discounts or other incentives can be offered to at risk customers to try to retain them.
- Retention Marketing: The at risk customers can be specially added to retention marketing lists so that Google Ads, Facebook, Twitter or Email campaigns be used to target them specifically.
- Customers with a low probability of churning can be removed from re-targeting lists, this could lead to cost saving in marketing.
If the company has segmented its customers and has an understanding of the types of customers with the highest lifetime value. Then the most valuable at risk customers can be targeted specifically with the above techniques.
Conclusion.
Information is plenty but insights are few. A company that collects data and knows how to gain insights from this data can get a deeper understanding of its customers.
Companies live or die by their customers and being truly customer centric means knowing your customers and treating each one, especially the most valuable ones, uniquely. With the amount of data available about your customers. There is no excuse for treating all you customers in a one-size-fits all manner.
P.s. If you run a start-up or company and you’re interested in understanding your customers more. Knowing the characteristics of your most valuable customers, finding out your at risk customers or learning how to properly collect and analyse customer data. Hit me up at [email protected] or visit us here.
Op–ed pieces and contributions are the opinions of the writers only and do not represent the opinions of Y!/YNaija
The author can be reached on twitter @DerinAdebayo
Leave a reply